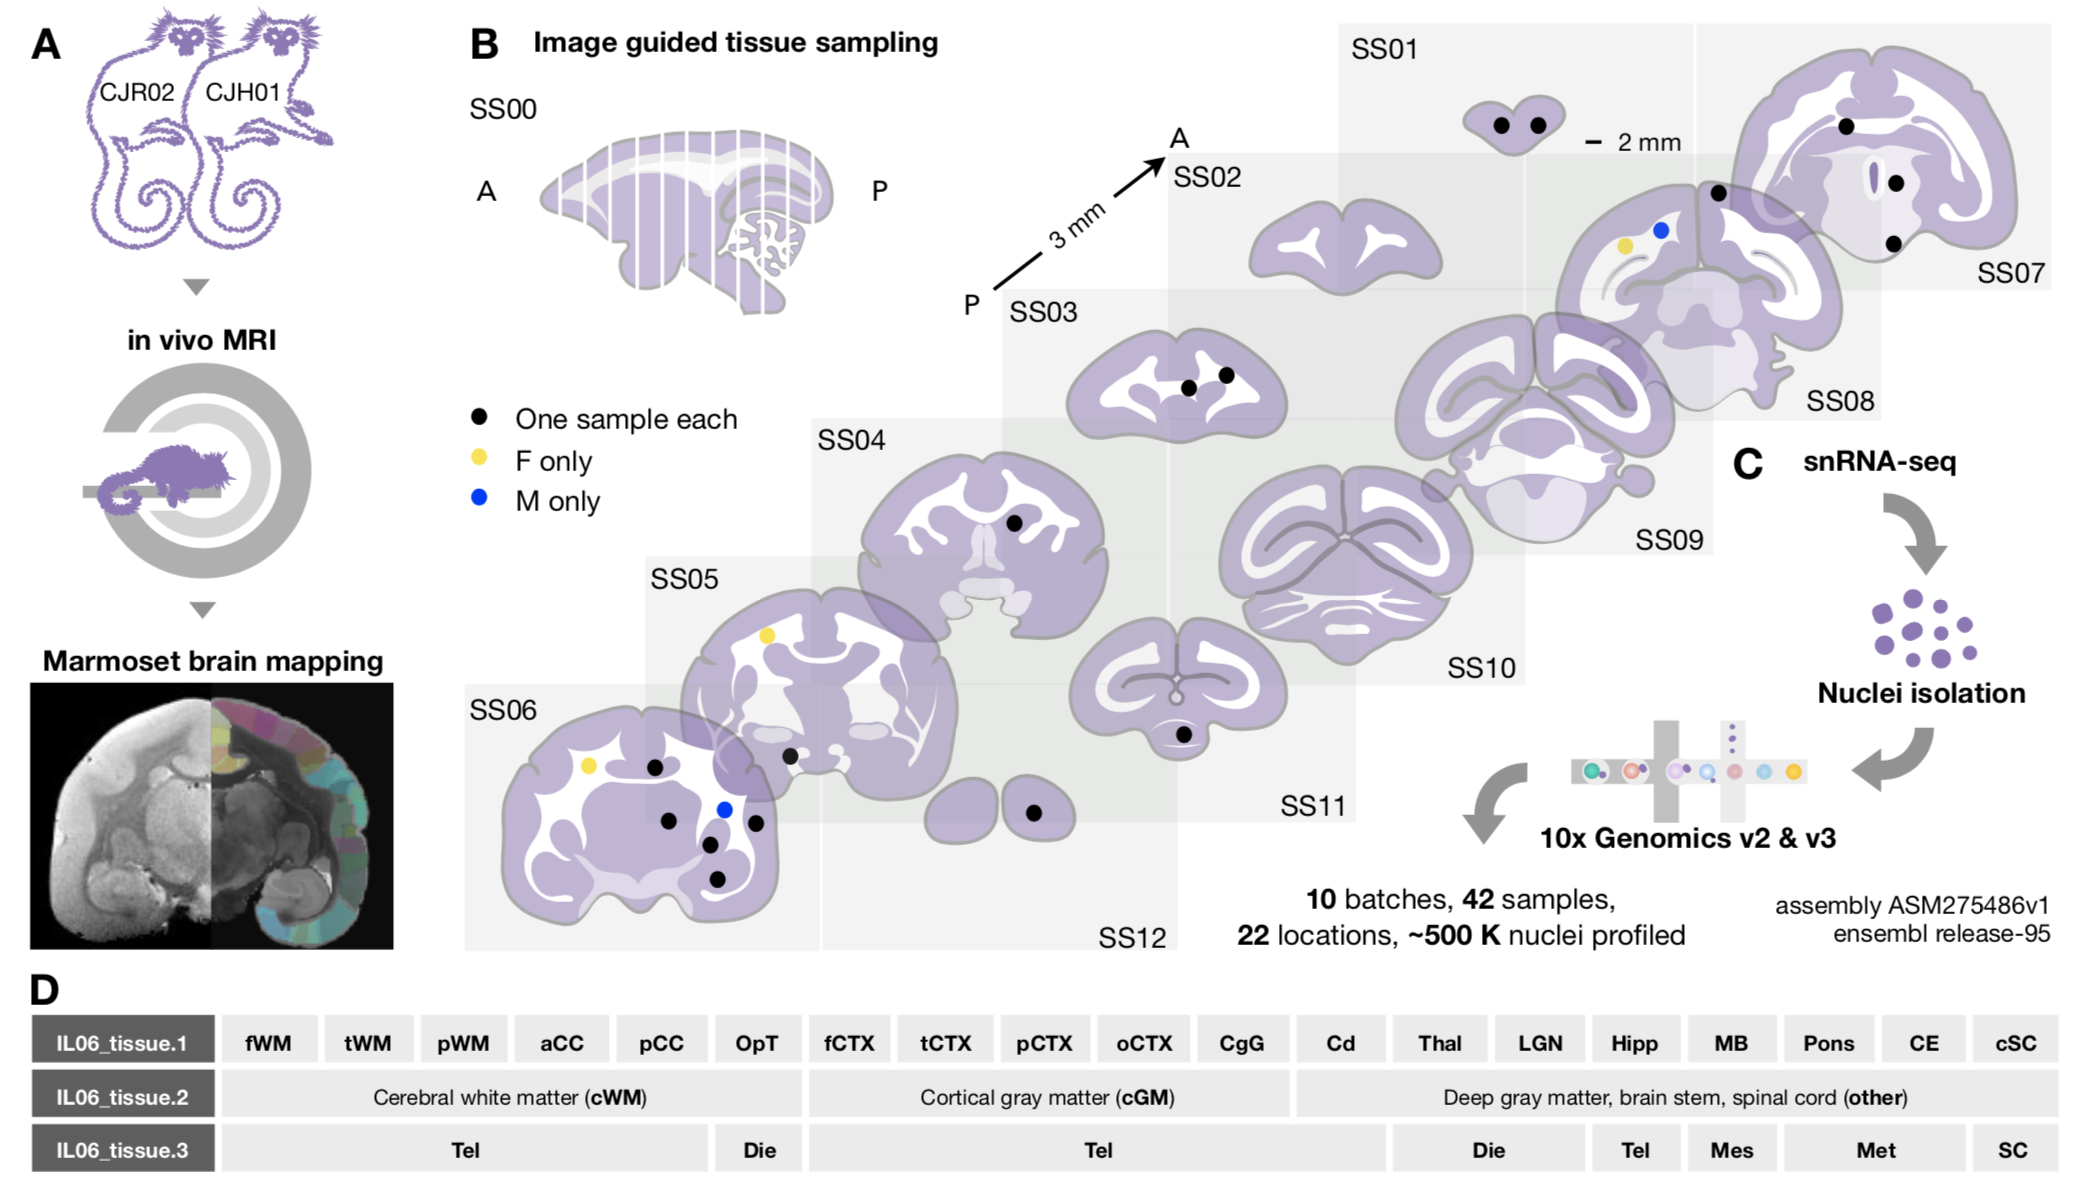
Loading...
Menu content 1
Menu content 2

Loading...
When switching dataset, please wait for a few seconds for this plot to load before toggling different tabs...
How to use CjPCA:
-
Switch dataset:
Select and click 1K, MIC, OPC, OLI, AST, VAS, NEU from the sidebar. Initializing dataset might take a few moments. Please wait for “UMAP” tab to load before toggling different tabs. -
Find gene/feature expression pattern:
-
Enter one or more genes at the sidebar: ✱ DotPlot
DotPlots show the expression of the currently chosen group within the selected dataset and across datasets. These are displayed in the “✱ DotPlot: local + group.by” tab and “✱ DotPlot: global” tab. Note: Only 50 nuclei per L2 subtype are included in “✱ DotPlot: global” calculation for quick comparison. Full expression profile with all nuclei is available in each L2 partition. -
Select one or more genes from “GeneList” tab
Select X entries shown from the drowpdown to refresh the table display. Click and select your gene of interest from the table. To unselect, click the highlighted cell in the table or hit “Reset selection” to unselect all. Currently selected genes will be shown at the bottom of the table. Choose “Submit for ✱ DotPlot” at the bottom to display DotPlots in the “✱ DotPlot: local + group.by” tab and “✱ DotPlot: global” tab. -
Enter one or more features at the sidebar: ✦ FeaturePlot.VlnPlot
The expression of the entered feature will be overlaid on UMAP and displayed in the “✦ FeaturePlot” tab. The expression level and distribution of the entered feature will be displayed in the “✦ VlnPlot + group.by” tab. Check or uncheck sidebar: VlnPlot.points to show or hide individual nucleus display on the VlnPlot.
-
Enter one or more genes at the sidebar: ✱ DotPlot
-
Explore 3D UMAP:
The orientation and zoom of the UMAP can be changed by dragging and scrolling the cursor. The display of each cluster can be toggled by clicking the legend. -
Change group option:
Select different options at the sidebar: group.by. The results in the “✱ DotPlot: local + group.by”, “✦ VlnPlot + group.by”, “NucleiNo. + group.by”, and “UMAP + split.by/group.by” tabs will be updated. -
Change view option:
Select different cell attributes in the sidebar: split.by. The results in the “UMAP + split.by/group.by” tab will be updated. Check or uncheck sidebar: UMAP.label to show or hide the annotation on the UMAP. -
Change group option in expression table:
Select different options in the sidebar: average.by. The results in the “ExpMx + average.by” tab will be updated. The matrix can be searched, filtered, and downloaded. -
Non-interactive tabs:
The plots, markers, and gene modules used in the preprint are shown in the “UMAP”, “GenePlot”, “GeneModule”, and “GeneList” tabs as reference.